Early alpha
Tyrian Bringing deeper insights to your existing telemetry. Upload your iRacing IBT files to surface the story hiding in your laps — corner by corner, lap by lap.
Drop an IBT file anywhere or click to browse Up to 500 MB Accounts are closed at the moment, so uploads are anonymous: your session gets a link anyone can open. Only the newest 100 anonymous uploads are kept; older ones are deleted automatically.
See it in action Real sessions, analysed by the same engine your upload goes through. Each map carries the session's heat — where its insights cost the most — and each strip is every lap, in order.
best 1:36.802 Lap 0 · 1:37.900 · Not counted: out lap Lap 1 · 1:43.689 Lap 2 · 1:37.484 Lap 3 · 1:55.284 Lap 4 · 1:37.321 Lap 5 · 1:36.892 Lap 6 · 1:36.802 · session best Lap 7 · 1:45.062 Lap 8 · 1:37.582 Lap 9 · 1:38.425 · Not counted: off-track incident Lap 10 · 1:44.518 · Not counted: off-track incident Lap 11 · 1:36.553 · Not counted: off-track incident Lap 12 · 1:37.857 · Not counted: off-track incident Lap 13 · 1:36.918 Lap 14 · 1:49.396 Lap 15 · 1:38.125 Lap 16 · 1:37.425 Lap 17 · 1:43.817 · Not counted: incomplete lap lap times, lap 0→17
16 insights 9 · 4 · 3
“Turning while braking — impact leading to loss of control”
Open session → best 0:27.759 Lap 0 · 0:31.967 · Not counted: out lap · off the top of the scale Lap 1 · 0:29.834 Lap 2 · 0:27.759 · session best Lap 3 · 0:36.400 · Not counted: incomplete lap · off the top of the scale lap times, lap 0→3
11 insights 4 · 4 · 3
“Front wheels locked”
Open session → best 1:25.425 Lap 0 · 1:36.767 · Not counted: out lap · off the top of the scale Lap 1 · 1:25.425 · session best Lap 2 · 0:55.683 · Not counted: incomplete lap lap times, lap 0→2
3 insights 2 · 1
“Turning while braking — major incident”
Open session → best 2:06.987 Lap 0 · 2:13.617 · Not counted: out lap · off the top of the scale Lap 1 · 2:06.987 · session best Lap 2 · 2:07.703 Lap 3 · 1:27.733 · Not counted: incomplete lap lap times, lap 0→3
3 insights 3
“Turning while braking — snap oversteer — caught”
Open session → best 2:08.326 Lap 0 · 3:31.917 · Not counted: out lap · off the top of the scale Lap 1 · 2:08.326 · session best Lap 2 · 2:17.256 Lap 3 · 2:02.150 · Not counted: incomplete lap lap times, lap 0→3
16 insights 9 · 3 · 3 · +1 more
“Major incident”
Open session → More from the app Straight from the app, across four real sessions — Suzuka, Interlagos, Long Beach and Mount Panorama.
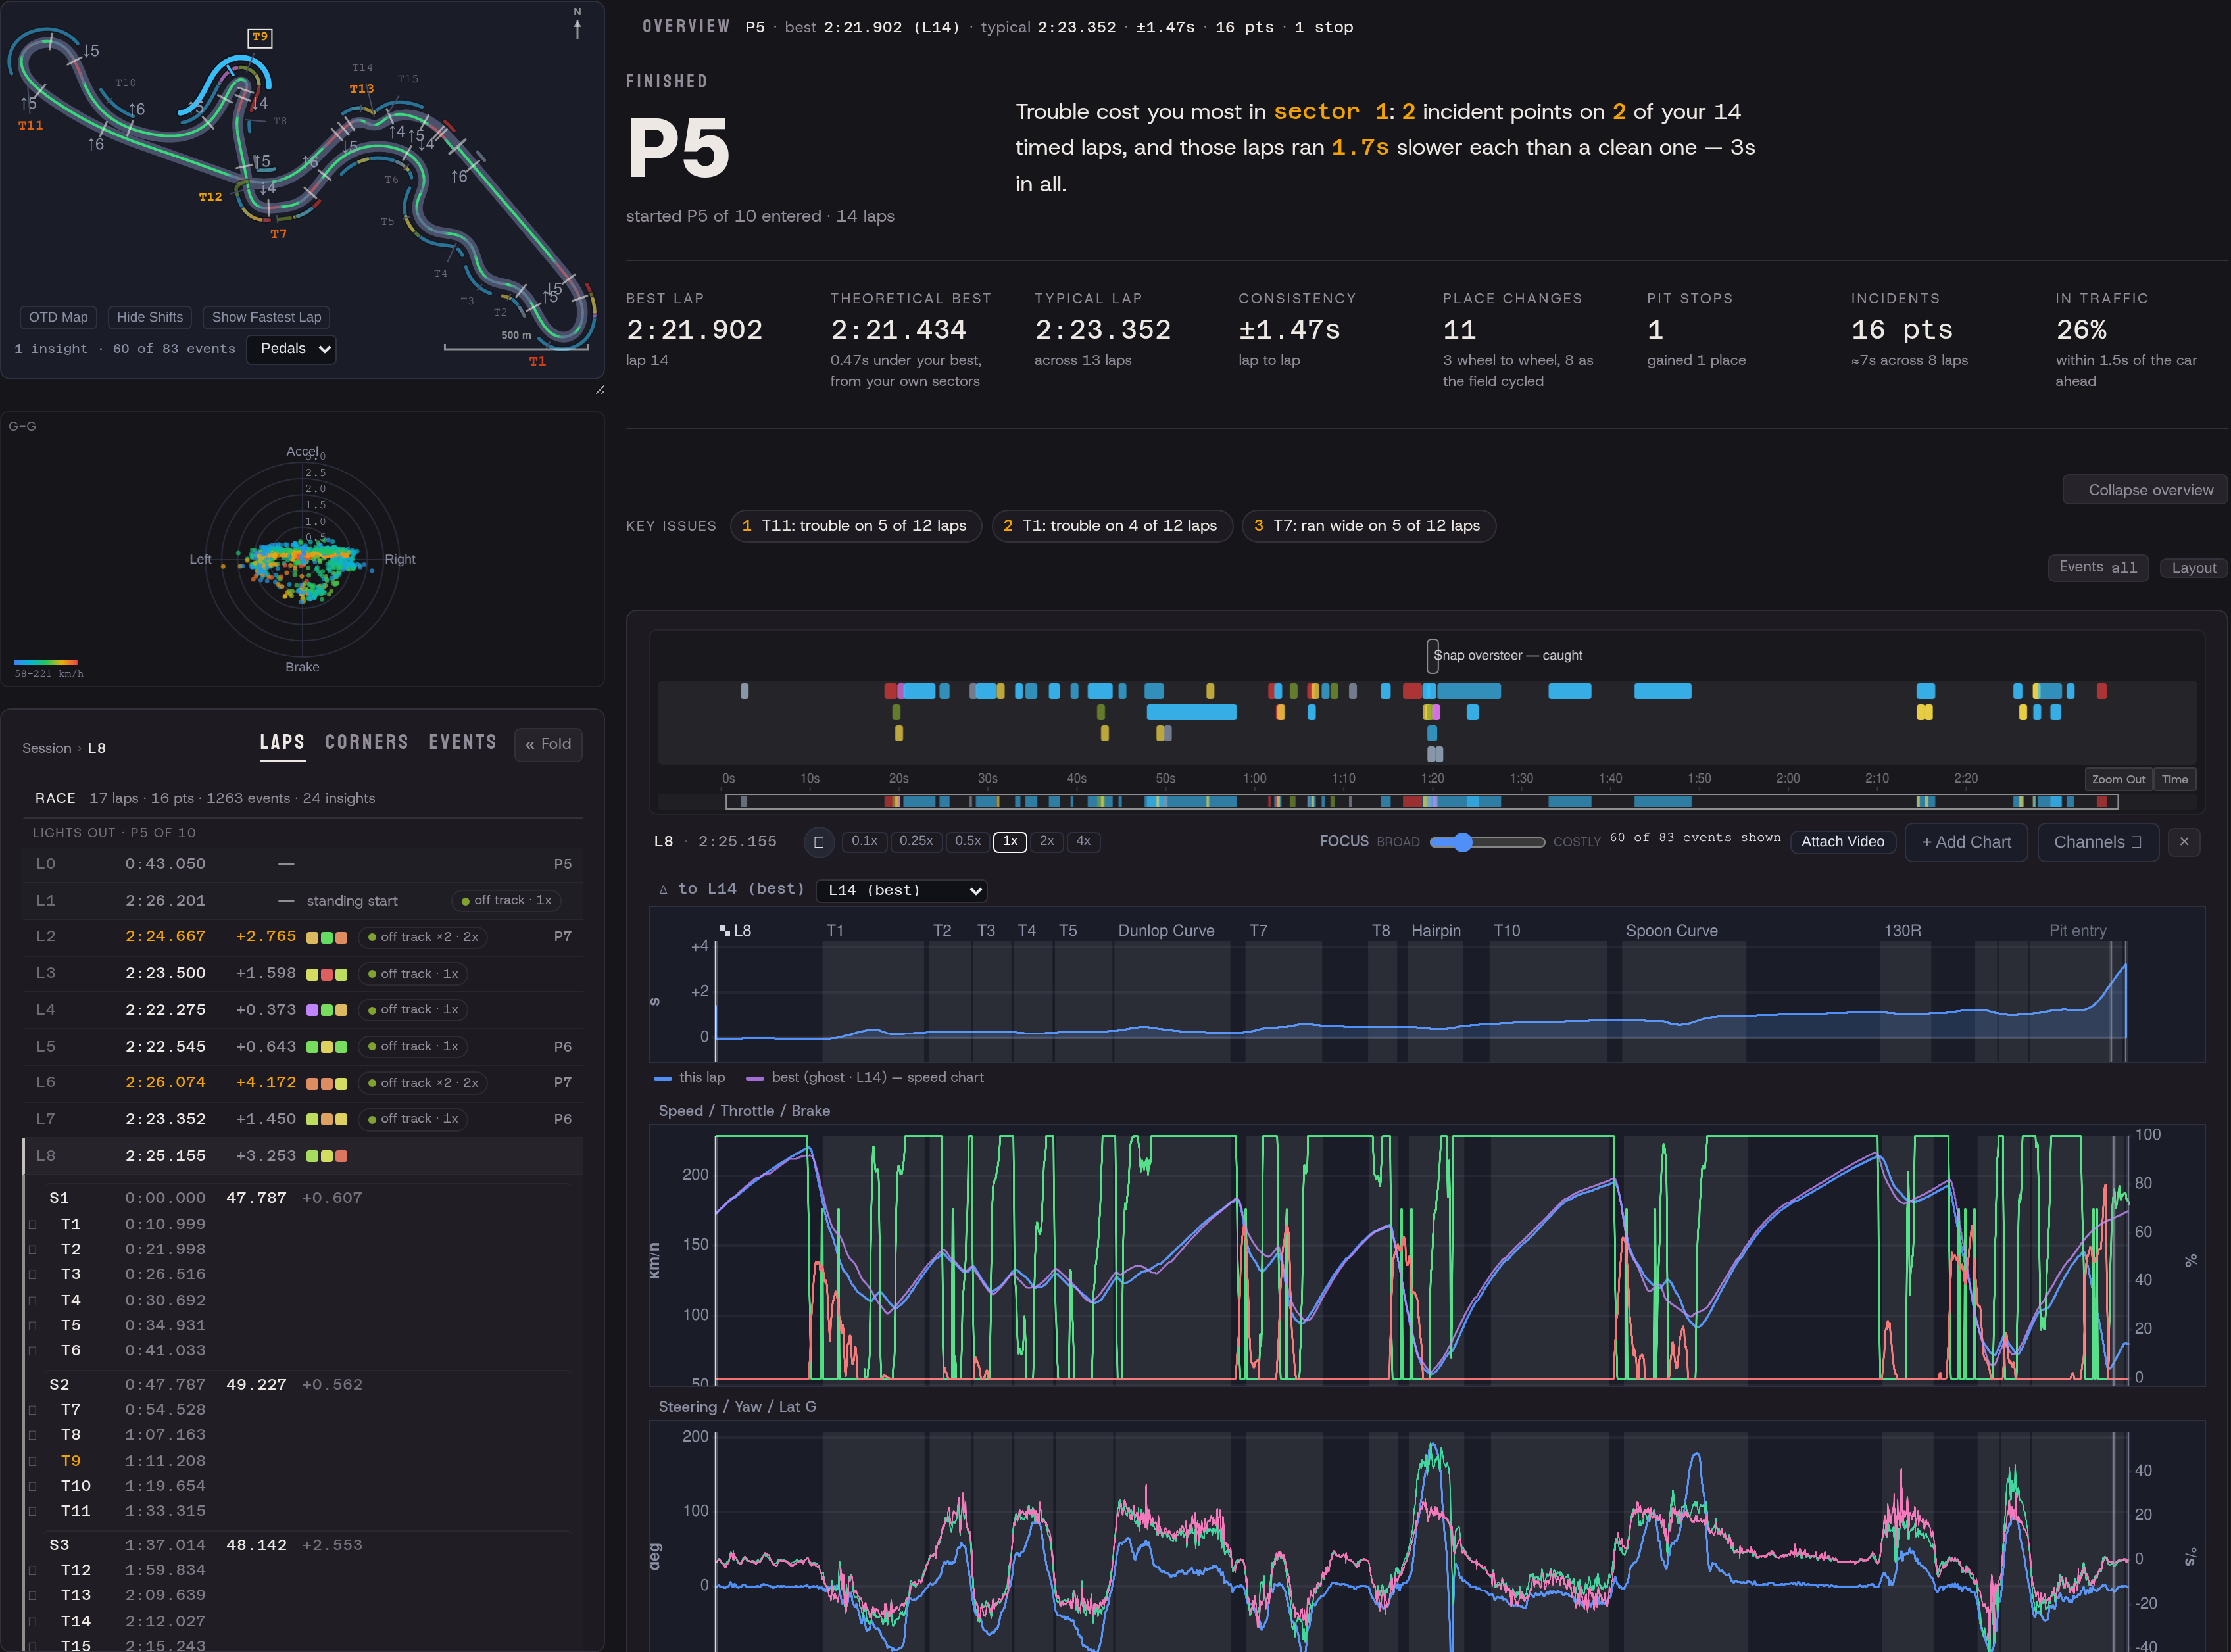
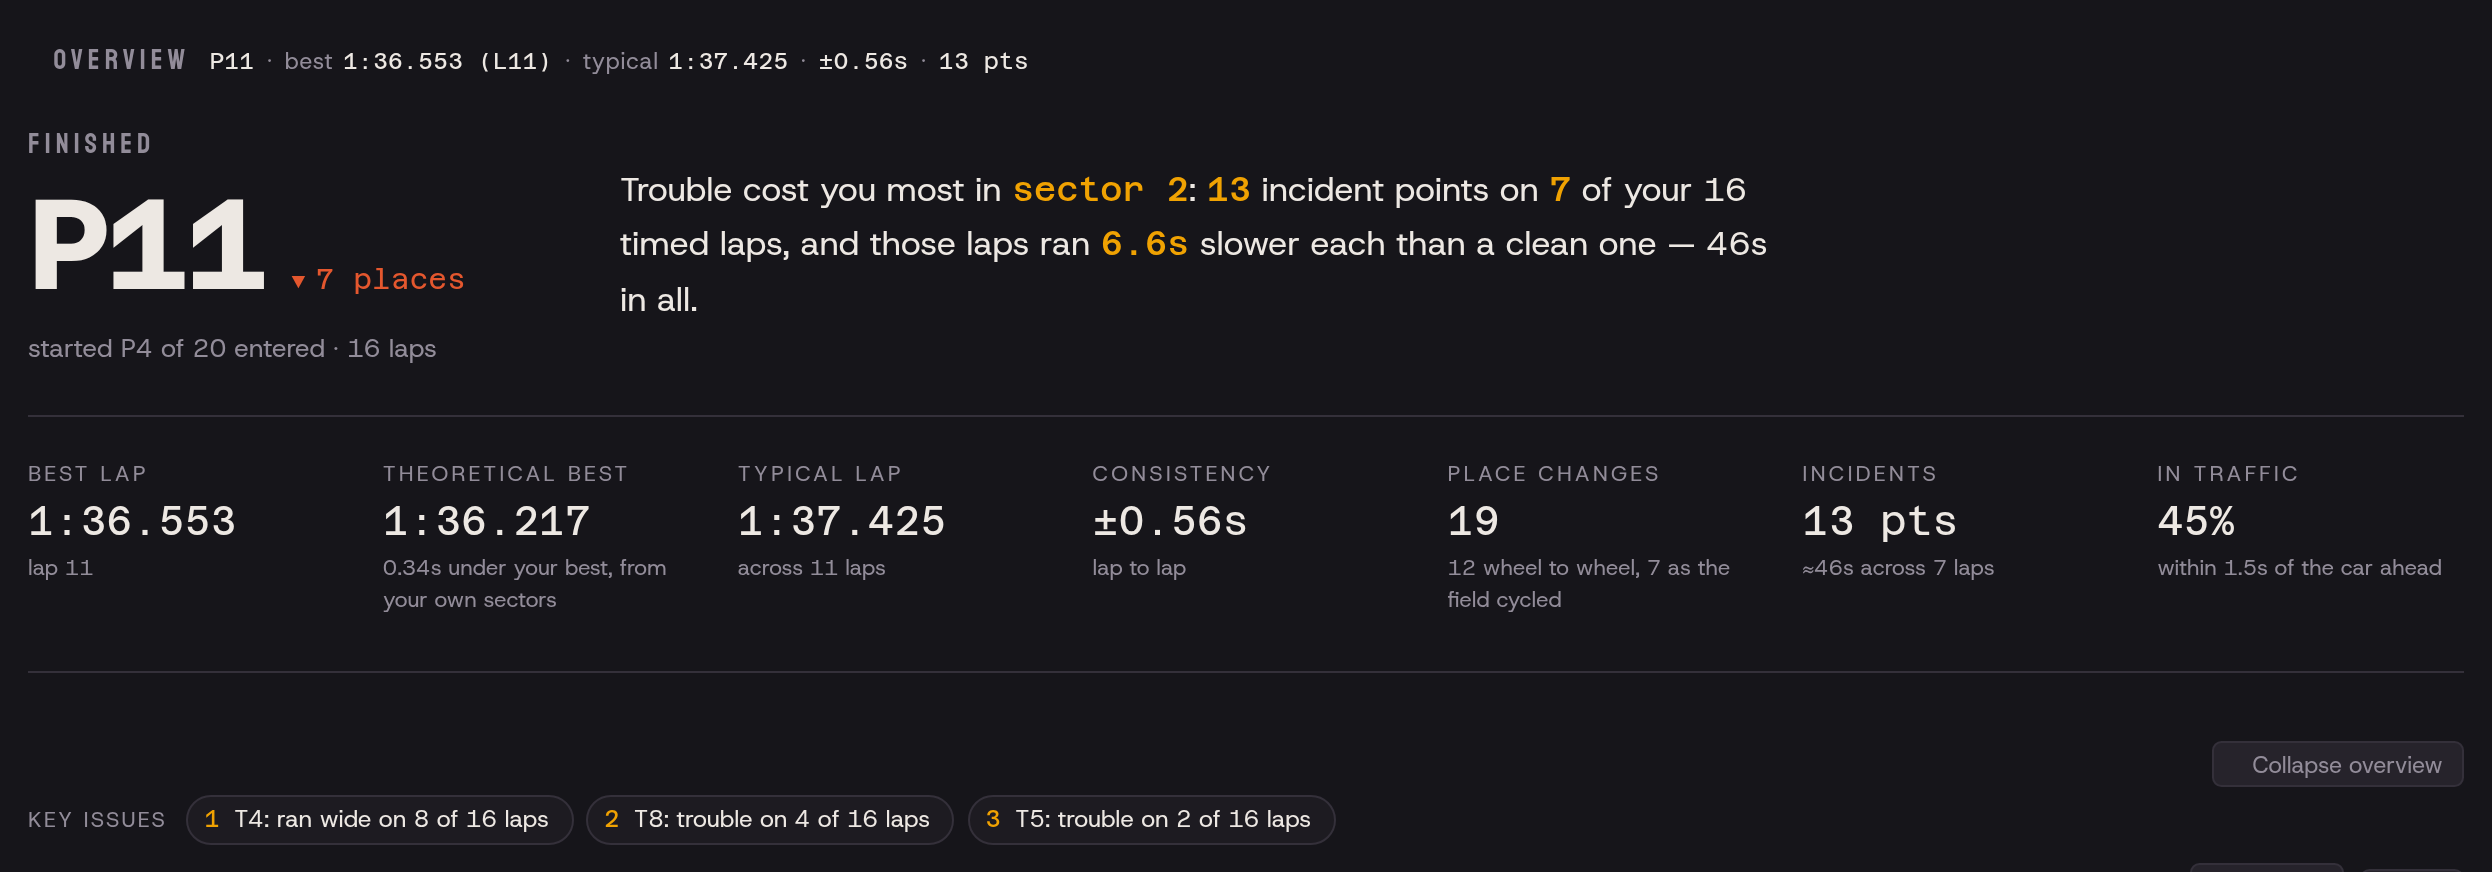
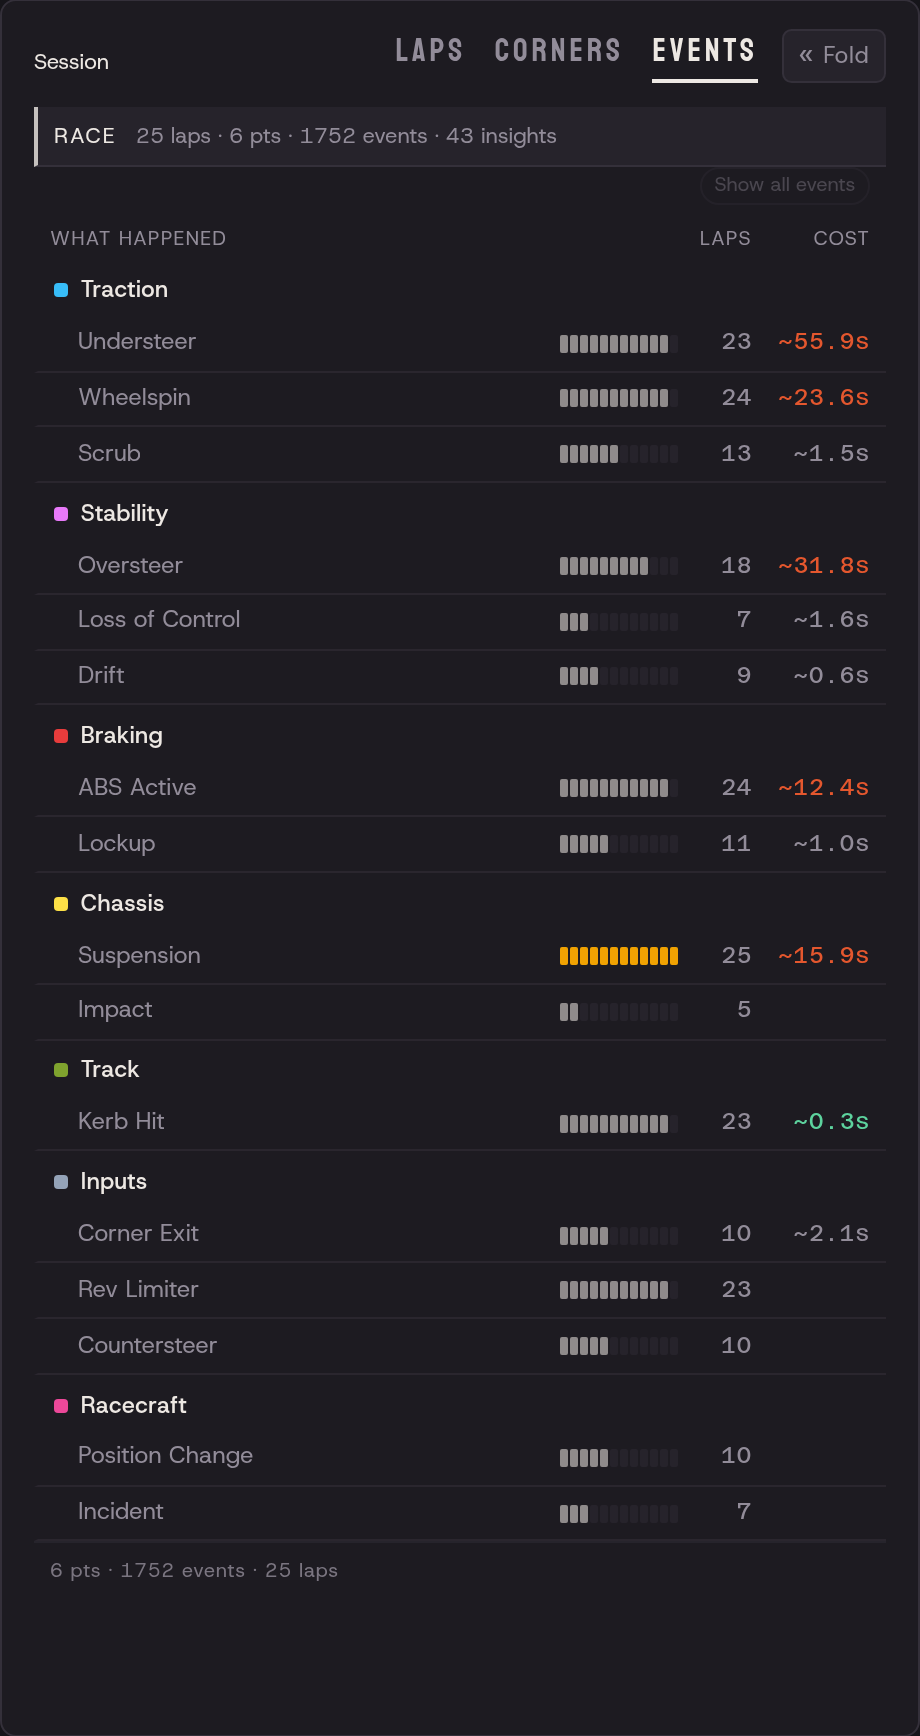
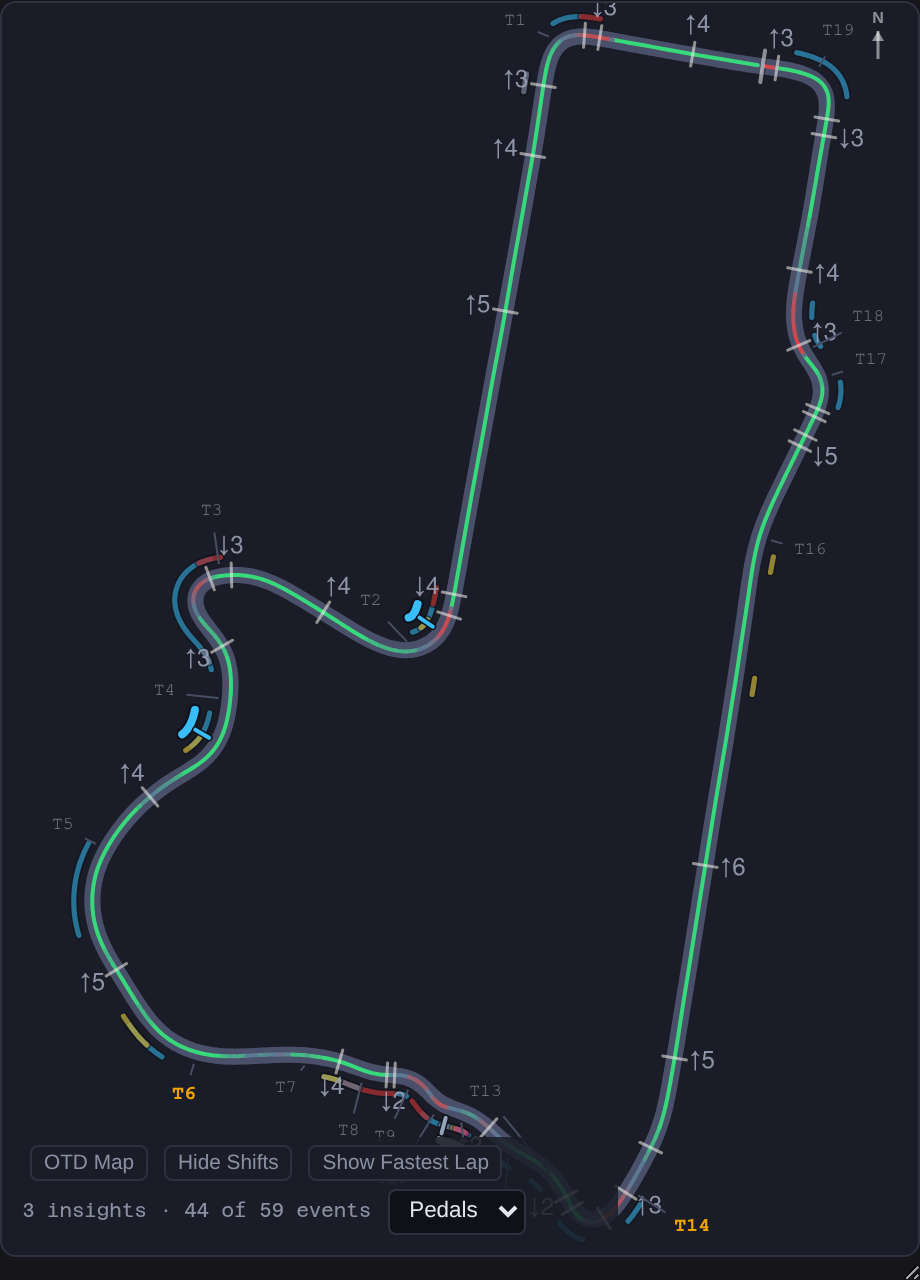
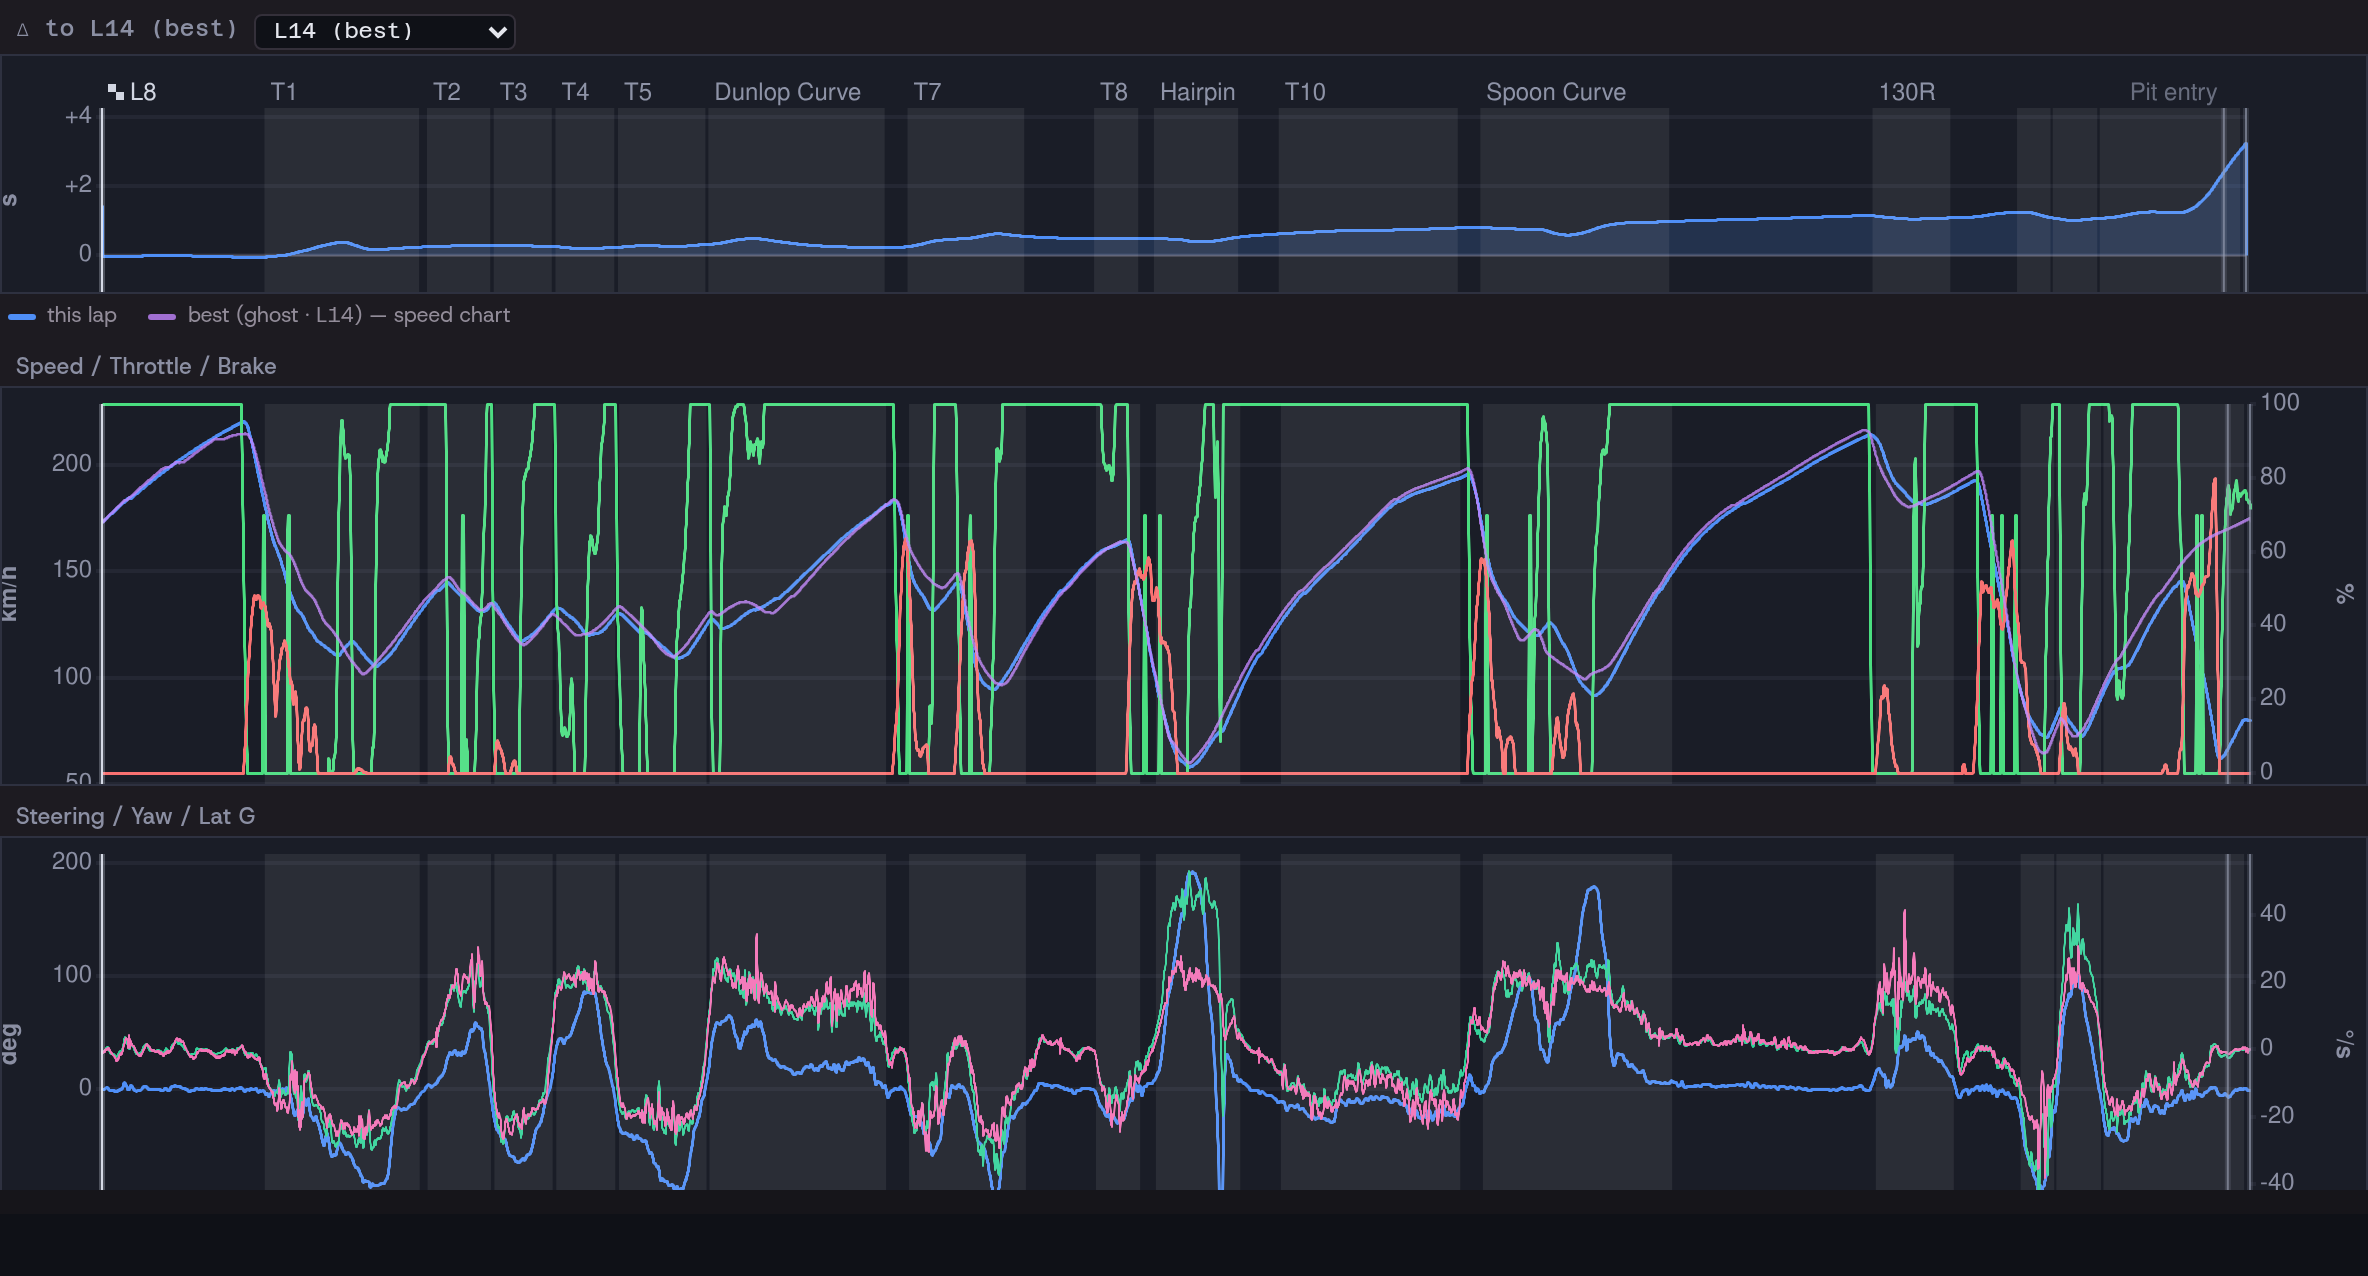
Everything on one screen The map, every lap, the verdict and the telemetry, all driven by one selection. The map and the lap list hold still on the left while the charts scroll on the right. Suzuka, BMW M2. Where the time actually went The result, how consistent you were, what trouble cost — and the three things worth fixing first, each ranked by how many laps it showed up on. Interlagos, Porsche 911 Cup. Every event, ranked by cost 23 detectors across eight categories. Each row shows the laps it happened on and roughly what it cost you. Long Beach, BMW M2. Corners named, events on the line Each corner labelled outside the circuit with a leader line to its apex. Events ride the lane hugging the road; the insights they group into ride outside them. Mount Panorama, BMW M4 GT3. Scroll the whole session The axis is session time, not lap distance, so you can scroll and zoom straight across lap boundaries. Corner names, lap lines and pit landmarks are all clickable. One line per thing that happened Insights on top, the events they were clustered from underneath, on a scrubbable ribbon with a minimap. Recently uploaded Race Autódromo José Carlos Pace Porsche 911 Cup (992.2) 18 laps 1:36.802 4d ago Map of Autódromo José Carlos Pace. Session heat: 16 insights on 10 of 18 laps 20 cars · P4 → P11 ▼7 · 25°C, mostly cloudy
lap times Lap 0 · 1:37.900 · Not counted: out lap Lap 1 · 1:43.689 Lap 2 · 1:37.484 Lap 3 · 1:55.284 Lap 4 · 1:37.321 Lap 5 · 1:36.892 Lap 6 · 1:36.802 · session best Lap 7 · 1:45.062 Lap 8 · 1:37.582 Lap 9 · 1:38.425 · Not counted: off-track incident Lap 10 · 1:44.518 · Not counted: off-track incident Lap 11 · 1:36.553 · Not counted: off-track incident Lap 12 · 1:37.857 · Not counted: off-track incident Lap 13 · 1:36.918 Lap 14 · 1:49.396 Lap 15 · 1:38.125 Lap 16 · 1:37.425 Lap 17 · 1:43.817 · Not counted: incomplete lap best L6 · 16 timed
16 insights 9 · 4 · 3
Turning while braking — impact leading to loss of control Turning while braking — 200° left loss of control Open session → Practice Mount Panorama Circuit Porsche 911 Cup (992.2) 4 laps 2:08.326 4d ago Qualifying Shell V-Power Motorsport Park BMW M2 Racing (G87) 4 laps 2:06.987 4d ago Qualifying WeatherTech Raceway Laguna Seca BMW M4 GT3 EVO 3 laps 1:25.425 4d ago Practice USA International Speedway Dirt Mini Stock 4 laps 0:27.759 4d ago Anonymized — showing the 10 most recent uploads across all drivers.
What you get Upload a lap and Tyrian goes to work — detecting mistakes, scoring corners and laying it all out to explore.
What the analysis finds Every upload is scored automatically, and overlapping events are grouped into the handful of things that actually happened.
23 detectors across eight categories — traction, stability, braking, chassis, track, inputs, racecraft and diagnostics Events cluster into insights, so a spin is one thing that happened rather than four separate alarms Per-event time-loss estimates, and the three issues worth fixing first ranked ahead of the rest Recurring problems told apart from one-offs — trouble on 8 of 12 laps reads differently from a single mistake How you explore it One selection drives the map, the lap list and the charts together.
A chart stack on session time rather than lap distance, so you scroll and zoom straight across lap boundaries One row per lap with sector times, deltas and event chips — or switch the same rail to corners, or to an event ladder ranked by cost Open any lap into its own drawer, timed corner by corner against your best Filter to a kind of event and it highlights on the map, the lap list and the timeline at once Deep links that survive reanalysis — lap, corner, viewport, playhead and filter all ride the URL What's on the picture Synchronised surfaces that agree with each other.
GPS track map with corners named outside the circuit, and two lanes of marks — the events, and the insights they group into Insight timeline with a narrative lane above the event lane, time / distance / percent axes, zoom, pan and a minimap uPlot charts with one cursor across every graph and live readouts A delta chart against any reference lap, with a ghost trace of your best 21 computed channels — slip, weight transfer, balance and more — plus surface bands read from the sim's own enums Drop a video onto the page and it plays in sync with the charts Sessions and data The context around the laps, and a way to get your numbers out.
Pit visits stamped from the sim's own track location — entry, standstill and exit drawn on the charts and as a seam between the laps Sector times on every lap, toned against the spread of that session's own laps Conditions in the header — sim time of day, sky, wet flag, air and track temperature Export a Markdown digest, the whole session as JSON, or lap times as CSV Known issues It's early alpha — here's what's rough so you know what to expect.
Insights still need work — expect rough edges and some calls that miss the mark. Sharing is not wired up: you can't make a session public or send anyone a link to one. Track map generation can be iffy on incomplete laps (active reset points, out-laps and teleports can distort the outline). Event detection thresholds may be too sensitive right now — they're actively being tuned. Privacy Accounts are closed at the moment, so every upload is anonymous. An anonymous session is public — anyone with the link can open it — and only the newest 100 anonymous uploads (up to 100 GB between them) are kept; older ones are deleted automatically. Nothing on the page attributes a session to whoever uploaded it.
By uploading telemetry to Tyrian you grant the operator the right to use it. Uploaded telemetry may be retained and used for testing and debugging purposes.